The northernmost town in Costa Rica is Peñas Blancas at 11° 13′ N, and the southernmost point is Cocos Island at 5° 53′ N. Because of its proximity to the equator, temperatures in any given place only vary about 20 degrees year-round. However, with elevations that span from sea level to 12,533 ft. at the top of Cerro Chirripó, Costa Rica has many different microclimates. Whether you prefer weather that is on the warm side or the cool side, you’ll be able to find a place where the temperature range is just right for you. I’ll share some maps and other tools that will help you find your ideal weather.

Costa Rica Topo Map – Copyright: Costa Rica Map Project
One of the most important factors in determining your ideal climate is elevation. We know people in Costa Rica who are quite comfortable living near the ocean and others who are comfortable living at elevations above 7,000 ft. We have experienced several different elevations and found that we are most comfortable between 2,000 and 5,000 feet. That covers a lot of ground! Here’s a topography map that will help you see the elevation ranges across Costa Rica.
You can find a really handy tool at Daft Logic altitude finder. It allows you to find the altitude of any place in the world. Just enter the name of a place, for example “San Jose, Costa Rica”. The tool will show you that the altitude of San Jose is 3819.561 ft. Then you can click on other locations outside of San Jose, and it will show you the altitude of each point.
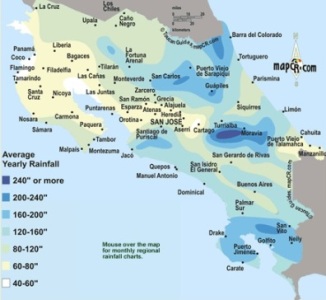
Costa Rica Rainfall Map
Copyright: Toucan Guides
It probably goes without saying that the reason Costa Rica is so green and lush is that it rains…a lot! We have explored Costa Rica during the dry season and later went back to experience the “green season”. Even in the green season, the mornings are usually clear and dry, and the rains roll in during the afternoon or evening, often raining very hard for a few hours. Some areas of Costa Rica get a lot more rain than others, and we’ve heard tales of towns that are only a few miles away from each other getting dramatically different amounts of rain. This rainfall map will help you see how much rainfall different parts of Costa Rica receive.
The dry season is generally from mid-November through May, and the green season is from June through mid-November, but that varies from place to place, and we’ve heard that rain on the Caribbean side is spread more evenly throughout the year. It can be difficult to get accurate weather information that you can use to compare different towns that you may be considering. One of the best sites I’ve found is Climate-Data.org. It shows you monthly high and low temperatures in both Celsius and Fahrenheit as well as rainfall in millimeters. You can use our handy conversion tool to convert millimeters to inches to help you grasp how much rain this is in familiar units. I’ve started you out with the climate data for Alajuela where the Juan Santamaria (SJO) Airport is located. You’ll see a list of nearby towns which you can click on to get detailed climate data along with a new list of nearby towns. After months of trying to dig out weather data online, I was like a kid in a candy store when I found the Climate-Data.org website!
It’s important to note that your favorite temperature range at home may feel quite different in Costa Rica. We moved to Costa Rica from Tucson, Arizona, where I felt very comfortable when the temperature reached 100 degrees and felt chilly when the thermometer dips below 77. However, due to the high humidity in Costa Rica, I feel comfortable in the low 70′s to low 80′s here and find temperatures much higher than that a bit uncomfortable. If you haven’t been to Costa Rica yet, be sure to go try the weather out on your own skin!